
Manufacturing dashboard software: describe it, MIE builds it.
MIE custom dashboards are manufacturing dashboard software you use by asking. Ask for the production dashboard or plant KPI view you need and it appears in your MIE menu, built on live plant data. No more requests passed from manager to junior to product team, and no more exported sheets. Custom dashboards are next on the MIE roadmap.
The usual way costs days. This takes minutes.
In most plants, a new dashboard is a small project. A manager asks a junior, who asks the product team, who exports sheets, builds a chart and sends a link days later. By then the question has moved on.
With MIE the manager just asks, and the dashboard appears in their menu. It reads the same live data as the rest of MIE, so there is no export to go stale.
- Manager asks a junior
- Junior writes it up for the product team
- Team exports sheets and builds a chart
- A link arrives days later
- Ask in plain English
- Review the draft
- Pinned to your menu
Ask, review, keep.
"Weekly dashboard for Line 1: output vs target by day, downtime by machine, energy per unit."
MIE drafts the panels. Change anything by asking: "make downtime a bar chart", "last 30 days".
Save it under Custom dashboards. Share it inside your company, pin it to wall mode or schedule it as a PDF.
Need something bespoke? Our team builds it within one working day, with no code changes on your side.
The plant KPIs you check every day, in one view.
A custom dashboard can use any machine, tag or goal MIE already knows about. You pick the numbers that matter to your line, your shift or your site.
If your plant tracks OEE, our guide on how to calculate OEE explains the inputs behind it.
- Output vs target. Units made today, this week or this month against the plan, by line or by day.
- Downtime by machine. Which machine lost the most hours this week, and how that compares with last week.
- Energy per unit. Energy use set against output, by shift, line or machine.
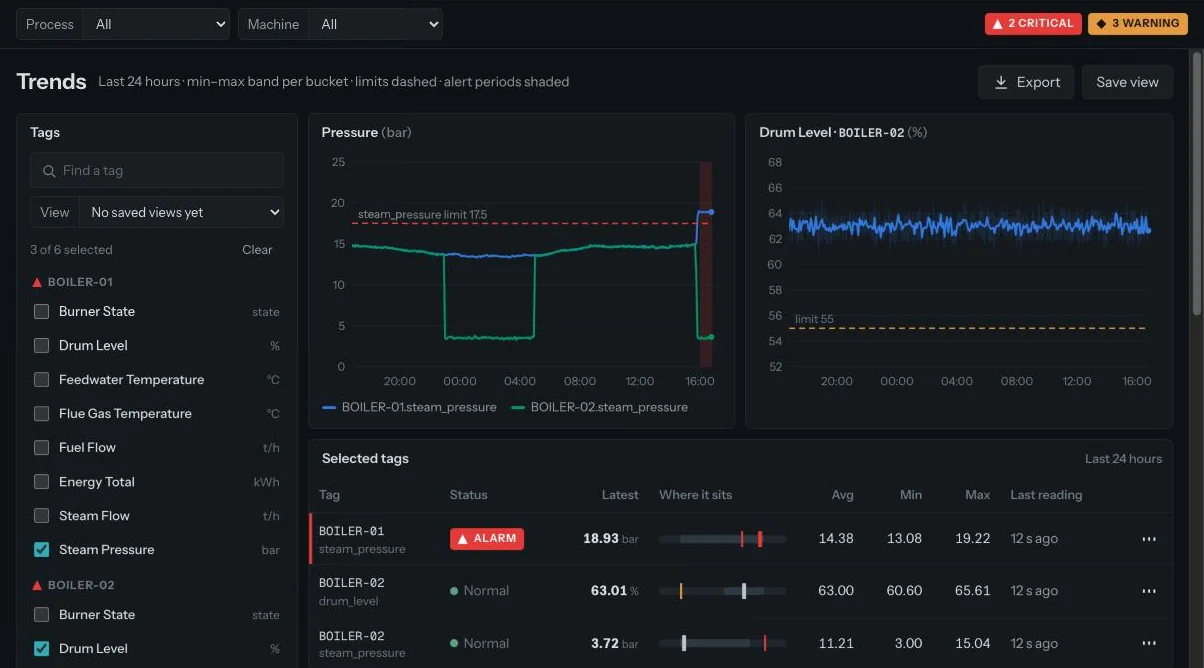
- Readings against limits. Any tag with its limit drawn in, like the trends view, for the machines you choose.
- Open alerts. What is firing right now, for a machine, a process or the whole plant.
A weekly Line 1 dashboard, start to finish.
Example. A plant manager wants one screen for the Monday review of Line 1. The line plans 2,000 units a day.
- Ask
"Weekly dashboard for Line 1: output vs target by day, downtime by machine, energy per unit."
- Draft
MIE drafts the panels: output today (say 1,942 of 2,000), downtime this week (say 7.4 hours, with COMP-01 leading at 4.1 hours), a daily output vs target chart and energy per unit.
- Adjust
The manager asks: "make downtime a bar chart" and "show the last 30 days". The draft changes as asked.
- Keep
The dashboard is saved as "Line 1 · weekly" under Custom dashboards, shared with the shift leads and scheduled as a PDF.
Dashboards built on the data you already have.
Custom industrial dashboards are only useful if the numbers are right. MIE only accepts readings from known machines and tags, and logs everything else with the reason.
- Machines and controllers. HTTPS, MQTT, OPC-UA and Modbus, from your PLC, gateway, historian or edge device. No new sensors.
- Business systems. SAP, Oracle, Microsoft Dynamics, SQL Server, PostgreSQL and Excel. Our team handles the mapping during setup.
- Live, not exported. Dashboards read the same live plant data as Plant, Trends and Alerts, and refresh with it.
- Checked first. Rejected readings never reach a chart, so a dashboard shows what the plant really did.
For everyone who asks for a report.
Output against the goal, downtime and energy for every line, without waiting for a spreadsheet.
Ask for the comparison you need for the morning meeting, and keep it for tomorrow.
A shift view pinned to wall mode, so the next shift sees where the line stands.
On the OEM plan, machine builders can embed live MIE dashboards in their own portals for each customer. See MIE for OEMs. For machine health and early warnings, see predictive maintenance.
Private, shared or on the wall. You choose.
A dashboard lives inside MIE, in the same menu as Plant, Trends and Alerts. There is no separate tool to log in to.
While custom dashboards are being built, plant overview, trends, machine pages and wall mode are live in MIE today. The MIE roadmap shows what comes next, and you can contact us to see them on your own plant data.
- Private or shared. Keep a dashboard to yourself or share it inside your company.
- Wall mode. Pin it to the control-room TV view, which refreshes every 15 seconds.
- Scheduled PDF. Schedule the dashboard as a PDF, so the same view arrives on time every week.
- Access you control. Role-based access, multi-factor sign-in and data isolated per company. See security.
Common questions.
Where do custom dashboards appear?
Is the data live?
Can other people in my company see them?
Are custom dashboards available today?
What is manufacturing dashboard software?
What can a production dashboard show?
Do I need a BI tool or someone who writes queries?
Which systems can dashboards use?
Ask the demo plant your own question.
We'll walk you through MIE on a live plant in 30 minutes.
Or call +91 98288 93692 · +91 88519 85656 · info@thinklytixai.com